
Seasonality is when things change in data in a repetitive and predictable way.
Like summer heat and winter cold, the data also have “seasons” that repeat.
Most datasets have seasonality, especially in the financial and economic sectors. Look at any economic statistics published by the government and you will often see that the headline figure is “seasonally adjusted” to remove seasonal bias.
Before we get into the technical-speak, let’s make sure we understand seasonality in practical, common-sense terms.
Some items are highly seasonal and predictable.
Gasoline consumption is seasonal. People travel and go out more in summer so they buy more petrol. Save for volatile events like global pandemics, you can bet this happens every year.
The graph above is the average gasoline demand/price in the US on a monthly basis over 20 years of data. As you can see, there is a predictable rise in summer over a 20-year period, which repeats almost every year.
That’s seasonality – predictable and recurring trends in data.
The same is true in retail sales. The holiday season is the biggest time of year for the retail industry and often accounts for more than half of a quarter’s store sales. This is also very predictable.

Note the projected increase in retail sales during the holiday season each year from 2015 to 2019. This seasonal trend is seen in recessions and healthy economies.
In essence, seasonality simply extracts human behavior patterns from the data.
For that reason, it stands to reason that if trends in seasonal consumption of gasoline, home sales, and retail sales are highly predictable, then perhaps the public’s buying and selling of stocks can be somewhat predictable.
And it is true. There are real socio-economic factors that affect people’s buying and selling of stocks that happen at regular and predictable intervals which we will consider in this article.
But that statement needs a million asterisks and you’ll soon see why.
The problem of seasonality in the stock market
While, for example, gasoline consumption is predictable, it does not mean the future Price Gasoline is estimated. So many out-of-season factors affect gas prices that while it might be profitable to bet on just the season, it would be too noisy.
Furthermore, the real problem with betting on the season in any forex market comes with the fact that we are talking about it.
When traders know about predictable seasonal patterns, they trade based on them.
Let’s do a thought experiment.
Let’s say gasoline is $1/gallon year-round, except during the summer season, when the price increases by $2/gallon. This happens every year in the same predictable pattern.
Smart traders will start taking advantage of summer by buying the day before it starts. Their advance purchase on the day before the start of summer will increase the price slightly. So smart traders will start buying two days before to increase the price.
This will be an iterative process until there is capacity to outrun the summer effect and the price reflects this event throughout the year, obviously adjusted for the time value of money.
This is what people mean when they say “at a price”.
It is important to keep in mind that any easily observable seasonality in the markets will have some degree of value. This doesn’t mean you can’t profit from it, you just have to evaluate how much the effect is worth, and if the risk/reward arises.
It all makes sense too. Any time there is a reasonably obvious way to beat the stock market (provide better risk-adjusted returns than the broader market), many people will jump at it until the edge is priced in.
The stock market is a giant game of chess played by the smartest, richest people in the world, taking advantage of every easy edge there is.
The Summer Effect: “Sell in May and Go Away”
One of the oldest seasonal trends of the stock market is the tendency of a weak season in the summer.
Apparently one of the first observations of this effect was the result of traders realizing that London stockbrokers would take extended summer vacations, which would reduce volumes.
It’s also true that today’s Wall Street traders and portfolio managers spend more time and mental energy on their summer adventures in the Hamptons and New England.
So how does the “sell in May” strategy stand up to scrutiny? The easiest way to measure this is to look at the average monthly return in the S&P 500 for each month of the year:
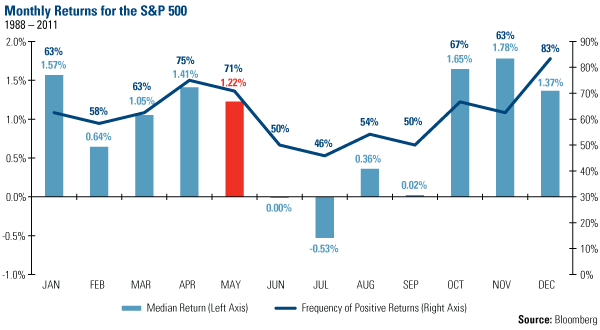
You can see that summer weakness in the stock market has a very observable seasonal effect.
A very simple way to implement this strategy is to hold stock from October to April and sell in May. There are some problems with this approach as spending roughly half the year out of the market can mean you miss out on strong rallies.
After all, summer weakness isn’t a rule, it’s just a statistical trend. Any given summer in the stock market can be extremely strong, such as Summer 2020 in tech stocks for example:

Additionally, the S&P 500 averaged positive returns during the summer as well (just weaker than the rest of the year), so you’re missing out on gains by staying out of the market.
Santa Claus Rally
The Santa Claus rally is the stock market’s annual Christmas present. It refers to the seasonal outperformance of the stock market during the festive season.
There is no fixed time frame to define the Santa Claus Rally.
Some start the holiday season a week before Thanksgiving and end the day after New Year’s Day, while others use a much shorter time frame of trading days after Christmas Day, ending the day after New Year’s Day.
There is no clear reason to explain this seasonal effect, although some theories relate to increased investment activity due to year-end tax-related trading or holiday bonuses/gifts. Our job is not to find the cause, but to exploit these tendencies for profit.
This effect is similar to “sell in May and walk away”, except it focuses only on the winter months which are the primary source of outperformance.
Here’s a chart showing the seasonal strength of the S&P 500 during the holiday season from 2000 to 2020:

Market Holiday Effect
The stock market has a peculiar tendency to lead to outperformance in the days leading up to and following market holidays. These don’t have to be major holidays, either, as this effect holds true for any day the market is closed, such as Memorial Day or President’s Day.
Note that ‘market holiday’ in this context means that the stock market is closed for that day.
This trade involves buying the S&P 500 or the Dow Jones Industrial Average three trading days before a given holiday and holding it three trading days after the holiday.
Tax Loss Harvesting/Selling Seasonality
One of the more explainable seasonal trends in the stock market is directly related to human behavior.
There are real incentives to play this predictable and repeatable piece of human behavior, which makes this strategy one of the strongest in the eyes of many seasonal traders.
This is called tax loss harvesting. To realize a capital deductible capital loss, investors sell their losing investments before the end of the calendar year, while at the same time replacing them with similar investments.
For example, let’s say you’re betting on oil stocks and shares owned by ExxonMobil (XOM). At the end of the year, you had a $10,000 loss on your Exxon shares.
You’d love to write off that loss against your taxable income but you’re still bullish on oil stocks. Some investors in this situation may sell Exxon and thus “harvest” the deductible loss, and then replace your Exxon shares with a very similar asset, such as Chevron (CVX).
Note that investors cannot simply realize a $10,000 Exxon loss and then simply repurchase Exxon shares, this would be considered a “wash sale” and your loss would not be eligible for the deduction. This is why investors will often shift their holdings of Exxon, which is not unlike Chevron but not the same.
So essentially the seasonal trend here is that weaker stocks tend to weaken in the last few weeks of the trading year, and bounce back as investors buy back their old positions when the new calendar year begins.
Now that you understand why this structural incentive to sell weak stocks at year-end exists, let’s look at some simple ways to use it.
One such strategy is to focus indeed Beat small caps, as these represent some of the biggest portfolio losers. An additional key point to put in your favor is to focus on stocks with less institutional ownership, as retail investors and traders tend to sell tax-loss more indiscriminately.
So the basic concept here is to find small-cap stocks with low institutional ownership that have really taken a beating over the year.
Bottom line
While seasonal trading is mainstream and a well-accepted form of alpha in the commodities world, it is still a red-headed step child in the stock market world.
The seasonality of goods is obvious to everyone; Grain harvests have seasons, gasoline consumption has well-established consumption trends, and so on. It is not so clear in the stock market.
But it’s pretty clear that seasonality exists in the stock market, it’s hard to find and even harder to explain.
The catch here is that while a business advantage is more specific and less widely accepted, it is also more profitable.
